| Unsubscribe |
Former tech executive Jeff Brown, the man who picked Nvidia in 2016, before it jumped as high as 37,800%, just got inside a Cybercab, Elon Musk's new car that has no steering wheel or pedals… and what happens will shock everyone. Click here to see the details or read more below.
Dear Reader,
In April 2026, Elon Musk announced he was partnering with Intel.
The result?
Shares took off…
And were trading 177% higher just two months later.
I believe Elon is about to announce a NEW partnership with this little-known company…
To work on what he called "the most epic AI project in history."
But you need to act fast…
Because Elon has already approached this company.
I believe he's going to make it official any day…
Which should send shares higher than anyone can imagine.
Click here to see the details.
We have so much to look forward to,
Jeff Brown
Founder & CEO, Brownstone Research
Rocket Lab's Record Backlog Could Fuel a Rebound, But Neutron Raises the Stakes
Authored by Thomas Hughes. Published: 11/10/2026.

Key Points
- Rocket Lab reported 73% year-over-year revenue growth and a record $3.6 billion backlog in the third quarter.
- Rocket Lab's technical indicators suggest a possible reversal, but its Neutron rocket is not expected to debut before 2027.
- Rocket Lab retains a Moderate Buy analyst consensus, although recent price-target cuts and continued losses present risks.
- Special Report: What if you already knew what to do? (From The Cycle Code)
Rocket Lab (NASDAQ: RKLB) shares fell more than 7% at one point in after-hours trading following an otherwise strong Q3 report. The move suggests the market failed to take off, even as RKLB was poised to rebound ahead of the release. However, investors shouldn’t read too much into it. Strong results were expected and delivered, setting up a potential sell-the-news, buy-the-dip scenario with shares trading well below their recent highs.
Rocket Lab's Technical Indicators Point to a Potential Reversal
Technical indicators point to a potential rebound that could take the stock to all-time highs if the stars align. That alignment depends on strategic execution, which the company’s results suggest is on track, with backlogs swelling and visibility improving. One developing signal is a Strong Buy reading on the Stochastic Oscillator across two time frames, and potentially a third, provided no major business hiccups, hurdles or setbacks arise.
Bring a pen (Ad)
Joel Peterson is opening up the system he has been building, and it starts with a single color-coded signal.
In a free workshop, he walks through a 3-step process you can learn in about five minutes, how it applies across stocks and ETFs, and a simple 20-minute weekly routine investors can start using right away.
You can even begin with what you already have, from as little as $25 a week.
Pick the workshop session that fits your schedule nowThe Stochastic Oscillator is interesting because it seeks to find order in chaos. It assumes that day-to-day price swings are random, but that prices will trend in one direction or another over time, depending on the fundamentals at play.
In this framework, a series of bullish crossovers near the bottom of the stochastic range—reflecting buying and firming support as successive troughs move higher—distinguishes a Strong Buy signal from a Weak Buy signal. The first bullish crossover is a weak signal and far less reliable on its own. For a signal to be strong, it must repeat at least twice and be confirmed by other indicators, a condition the MACD Histogram currently supports on the daily chart. MACD, or Moving Average Convergence Divergence, measures market momentum, indicating whether bulls or bears are in control and whether they are gaining or losing strength.
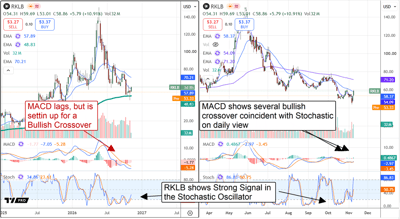
Bullish MACD crossovers on the daily chart echo the stochastic signals, setting the stage for a bullish momentum swing on the weekly chart. The weekly chart is the linchpin: MACD has yet to reflect a bullish crossover, but it is moving in the right direction. If it turns positive, the signal would provide further confirmation for technical traders and investors and could trigger a larger, more sustained influx of capital.
Rocket Lab's Monthly Chart and Growing Backlog Support the Bullish Case
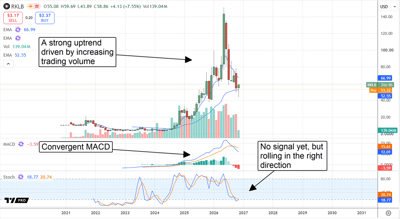
With signals developing on the daily and weekly charts, investors and traders could see a substantial move if and when the signal completes. The monthly chart provides the runway in this scenario, as it also reflects a deeply oversold market with potential to bottom and reverse. Signs of strength on this view include rising trading volume and MACD convergence within an uptrend, which could point to a retest of existing highs, if not the setting of fresh highs. Of course, this is all theoretical without a fundamental driver—something the company is happy to provide.
Rocket Lab demonstrated the strength of its vertically integrated space business, reporting nearly 73% year-over-year revenue growth and beating the Q3 consensus by more than 4%. Launch and systems sales drove growth, while industry-wide capacity constraints supported pricing. The only bad news was that losses were larger than expected, but strong execution helped offset that. The company is advancing across all business lines and actively pursuing its major acquisition of Iridium Communications, which would add an operational, profitable low-Earth-orbit constellation to its portfolio if the transaction closes.
Backlog and guidance are key catalysts. Backlog swelled 52% sequentially, driven by nearly $1 billion in new launch contracts, bringing the total launch backlog to 117 launches, including several for the Neutron rocket. The first Neutron launch is targeted for no earlier than 2027, with future revenue growth and margin improvements dependent on successful development and launches. Backlog stood at $3.6 billion at the end of Q3, equivalent to more than three years of revenue at the Q3 pace, although the timing of that revenue remains uncertain.
Price Targets Fall, But Analysts Remain Bullish on Rocket Lab
Analysts responded with mixed sentiment, weighing record Q3 revenue, backlog growth and guidance against wider losses. The positives kept sentiment at Moderate Buy, while the negatives led to some price target reductions, which weighed on market appetite. Investors should consider several factors underpinning the bullish outlook, including coverage from 24 analysts, 18 of whom rate the stock Buy or Strong Buy. The consensus price target of about $100 also implies roughly 70% upside, with upcoming catalysts providing additional potential support.
Rocket Lab’s catalysts center on backlog growth and contract conversion, which could reduce uncertainty in the outlook and drive robust revenue growth. Analysts forecast that growth could slow as early as next year, a potential headwind for the stock, but this is partly due to the law of large numbers and the company’s rapid expansion. Even so, revenue is forecast to grow about 40% in 2027. Sustaining a compound annual growth rate of about 30% over the next decade could allow the business to grow by more than 1,000% and potentially reach adjusted profitability within the next year or two.
The AI Debt Bill Is Coming Due, But Biotech Has Revenue to Show for the Boom
Authored by Bridget Bennett. Published: 11/11/2026.
Key Points
- AI builders are funding the boom with debt and stock sales, while the companies applying AI carry none of that financing risk.
- Tempus AI posted $411.5 million in third-quarter revenue, up 23%, with positive adjusted EBITDA and raised full-year guidance.
- Recursion Pharmaceuticals shows the other side of the trade—real clinical results, but a runway bought with dilution rather than earnings.
- Special Report: 6 Men Secretly Changed America’s Money. Now It’s Happening Again (From Banyan Hill Publishing)
The Nov. 5 sell-off settled an argument that had been building for weeks. The Nasdaq 100 fell 6.4%, its worst session since 2020, and the Philadelphia Semiconductor Index dropped more than 12% after Democratic midterm wins in key data-center states raised the odds of tougher AI regulation.
The risk being priced in is to the buildout itself: the debt, the permits, the power and now the politics. Companies that buy compute rather than pour concrete carry none of those risks.
Most obvious SPCX trade you’re overlooking…? ($5/share) (Ad)
A little-known company trading under $5 a share may be quietly critical to SpaceX's profitability. Its patented technology reportedly powers key systems the space giant can't operate without.
Chief strategist Ross Givens, a former JPMorgan wealth manager, says this overlooked player reminds him of past breakout suppliers like Qualcomm, Corning, and ASML - companies that profited by supplying essential tech behind bigger names.
See the $5 stock quietly powering SpaceX's operations now.History has run this script before. Many companies that built the railroads went bankrupt under their debt, while grain traders built fortunes using the rails. The dot-com fiber builders met a similar fate, while Alphabet (NASDAQ: GOOGL), Amazon.com (NASDAQ: AMZN) and Meta Platforms (NASDAQ: META) turned that bandwidth into empires.
The biggest AI winners may never own a data center. Biotech is making an early case for that role.
Infrastructure Debt and Policy Risk Now Sit With the Builders
Debt is the weak point in the builder story, according to Ross Givens, market strategist at Traders Agency. Neoclouds such as CoreWeave (NASDAQ: CRWV) carry expensive debt, and even cash-rich hyperscalers are issuing stock and bonds to fund capital expenditures on AI capacity.
New technology gets cheaper. As compute costs fall, builders could be left servicing heavy debt while prices shrink, even as the companies applying AI capture the gains. Givens compares it to Netflix (NASDAQ: NFLX) replacing a trip to Blockbuster. The winner didn’t build the pipes.
He isn’t calling for the end of AI, but money is moving from the companies building it to the ones using it. Biotech shows that shift most clearly: drug developers sit on enormous datasets, and AI lets them test and design treatments much faster.
Tempus AI Gets Paid on Both Ends of Cancer Data
Tempus AI (NASDAQ: TEM) sits closest to the cash. It tests tumors from cancer patients and builds a library of results. Doctors use its models to identify the treatments most likely to work, and drug companies license the same data to design new drugs.
Third-quarter revenue reached $411.5 million, up 23%, while adjusted EBITDA came in at $25.6 million, compared with $1.5 million a year earlier. Management also raised full-year guidance to above $1.60 billion. New collaborations with Bristol Myers Squibb (NYSE: BMY), Moderna (NASDAQ: MRNA) and Merck (NYSE: MRK) are expected to add roughly $192.5 million over five years. Shares climbed about 8% into the mid-$70s right after the rout, against a 52-week range of roughly $41 to $89.
Givens attributes the volatility to the company’s size, a dynamic NVIDIA (NASDAQ: NVDA) experienced when it was smaller. He sees room for a $14 billion company to become a $140 billion one and favors a 15% to 20% trailing stop rather than waiting for a pullback.
Recursion Pharmaceuticals Funded Its Runway With Dilution
Recursion Pharmaceuticals (NASDAQ: RXRX) is an earlier-stage, riskier position. Robots run millions of cell experiments while AI selects which compounds to develop. In the TUPELO study of REC-4881, an oral therapy for familial adenomatous polyposis, 87% of evaluable patients showed a reduced polyp burden after 12 weeks—13 of 15 patients overall.
The balance sheet needs a closer look. An October stock offering of 61.54 million shares at $3.25 raised roughly $187.2 million, bringing pro forma cash to nearly $748.7 million and extending the runway into 2029 from early 2028. Existing holders paid for that extra time.
Shares cleared the $3 to $4 band that held for most of the year, then slid nearly 10% in the sell-off and settled near $3.50, the lower edge of the level Givens considers necessary to keep the idea in play. The risk is binary: These stocks can lose most of their value overnight after a failed readout, while a single approved drug could multiply a share price.
Biotech ETF Exposure Spreads the Single-Trial Risk
For investors who don’t want everything riding on one trial, the iShares Biotechnology ETF (NASDAQ: IBB) spreads exposure across 248 holdings, led by Gilead Sciences (NASDAQ: GILD), Amgen (NASDAQ: AMGN) and Vertex Pharmaceuticals (NASDAQ: VRTX).
It set a record closing high above $221 in early November, then gave back a few percentage points in the rout, rather than suffering the double-digit decline seen among chipmakers.
The trade-off is that IBB is a broad biotech investment, not a direct bet on AI-driven drug discovery.
Its performance will also depend on clinical trial results, regulatory decisions and drug pricing, even if AI adoption accelerates.
What Would Break the AI Adoption Trade
None of this requires the buildout to collapse. It requires adoption to keep spreading and biotech to remain a leadership group. Rates are the pressure point: The 10-year yield is near 4.9%, and a December hike is back on the table, which puts the greatest pressure on unprofitable, long-dated names.
Givens walks through the entries, stops and chart setups behind positions like these every week. That’s where the difference between owning a trend and guessing at one shows up. Investors who want that education can join Ross Givens’ Black Ops Trading Club for live weekly sessions.
Watch whether biotech keeps absorbing capital on days when the chip trade breaks. Those sessions show whether this rotation has legs or was just one week of fear.
This email message is a sponsored email for Brownstone Research, a third-party advertiser of The Early Bird and MarketBeat.
If you have questions or concerns about your account, please feel free to contact our support team, based in South Dakota, at contact@marketbeat.com.
If you no longer wish to receive email from The Early Bird, you can unsubscribe.
© 2006-2026 MarketBeat Media, LLC. All rights protected.
345 N Reid Pl., Sixth Floor, Sioux Falls, S.D. 57103. United States..




No comments:
Post a Comment