Last note from me on this 
Microsoft's Earnings Problem: Even Great May Not Be EnoughWritten by Chris Markoch on October 23, 2026 
Key Points
- Microsoft reports fiscal Q1 2027 earnings on Oct. 28, with the stock trading near its 52-week high and little margin for a disappointing result.
- Analysts remain bullish with a $592.15 consensus price target, but Microsoft must hit its ambitious 45% Azure growth guidance and roughly $50 billion CapEx plans.
- Technical indicators show fading momentum, including bearish MACD divergence.
- Special Report: This little-known SpaceX stock surged 180 percent in weeks

Microsoft Corp. (NASDAQ: MSFT) heads into its Q1 report for fiscal year 2027 (FY2027) with very little room for error. The stock closed at over $530 per share on Oct. 21; that's within striking distance of its 52-week high of $553.72. MSFT is up about 33% since the company last reported earnings, raising the stakes for this release, scheduled after the market closes on Wednesday, Oct. 28. A stock near its high has already priced in plenty of good news. That's why a clean beat may not be enough to push it higher. Investors will want a beat that also raises the bar for the rest of the fiscal year.
Dr. Mark Skousen has studied every major market boom of the past 126 years. He says today's conditions resemble only two prior moments - January 1995 and March 2009 - both of which preceded major Nasdaq rallies.
Skousen and colleague Matt McCall break down what this pattern could mean for the next 12 months, plus share one stock pick free of charge. Watch the free interview now to see the full analysis
Analysts Are Bullish on MSFTThe good news is that analysts don't appear to be worried. The Microsoft analyst forecasts on MarketBeat give the stock a consensus price target of $592.15, up from $578.73 less than two weeks ago. That implies roughly 12% upside from current levels. Adding to the bullish sentiment, of the 49 analysts MarketBeat tracks, 43 rate the stock a Buy. The latest moves are notable. Jefferies raised its target from $575 to $650 on Oct. 14. Citigroup followed a day later, lifting its target from $600 to $636. Wells Fargo sits near the high end of the range with a $725 target. Microsoft Azure Growth: Can It Hit 45% Guidance?As usual, Azure is the headline number to watch. Last quarter, Azure grew 43%, ahead of the 40% analysts expected. The business also topped $100 billion in annual revenue for the first time. Then management raised the stakes. Microsoft guided for 45% Azure growth in constant currency this quarter. That was well above the roughly 41% analysts had modeled at the time. However, that makes 45% the baseline, not the upside case. The market has a history of punishing Microsoft for small misses. In January, Azure grew 38%, beating guidance. The stock still fell 10% because the buy side was expecting more. Microsoft guided for total revenue between $89.85 billion and $90.95 billion. Analysts expect earnings of roughly $4.70 per share. Last quarter, the company posted $4.74 per share, topping the consensus by 50 cents.
In 1999, George Gilder predicted phones would outpower desktop computers. Apple's iPhone followed, and the stock climbed 12,107 percent.
He called streaming video over Blockbuster in 1990 and flagged an obscure online bookshop named Amazon in 1996. Netflix rose 118,823 percent at its peak; Amazon is up 250,300 percent counting splits.
Gilder now points to three converging technologies he calls the Trillion Dollar Triangle, which he believes could outweigh those past breakthroughs combined. See the Trillion Dollar Triangle George Gilder is pointing at now
Microsoft Spending: Why AI Stocks Are WatchingThe second number may matter even more. Microsoft guided for about $50 billion in capital expenditure (CapEx) this quarter. That's up from roughly $36 billion in the prior quarter. The company also projected $175 billion in CapEx for calendar 2026. Investors will listen closely to the tone around that spending. Microsoft has said demand still exceeds its available capacity. That's the bullish case for continued investment. But any hint of a pause would ripple far beyond Redmond. Chipmakers, data center operators and power suppliers all depend on hyperscaler budgets. A slowdown signal from Microsoft would likely be read as a bearish sign for the broader AI trade. There's a counterweight to watch. Free cash flow fell 23% year over year last quarter. Investors want spending to stay aggressive, but they also want proof it's paying off. Xbox and Game Pass: Can Microsoft Gaming Return to Growth?Gaming rarely moves Microsoft stock, but it could shape the narrative. In July, CEO Satya Nadella said he expects Xbox to return to growth in fiscal 2027. That's a bold promise after a rough year. Xbox revenue fell 7% in fiscal 2026. Hardware revenue dropped 29% on lower console sales. Content and services, which include Game Pass, declined 10% in the fourth quarter alone. Management guided for another mid-single-digit decline this quarter. That makes October's launch of Gears of War: E-Day an early test. The game set a franchise record with more than 31,000 concurrent players on Steam. Yet estimates from Alinea Analytics put early unit sales at only about 230,000 copies. The bigger number is subscriptions. The same estimates show about 1.7 million players accessing the game through Game Pass. Microsoft is betting on recurring subscription revenue over one-time game sales. Gears launched in the current quarter, so it won't show up in these results. But management's holiday-quarter outlook could reveal how much it's counting on the franchise. Any update on Game Pass growth will be a tell for the turnaround. MSFT Stock: Momentum Fades Near HighsThe technical picture is constructive, but momentum is fading. MSFT gapped higher after its July report and has trended up since. The stock remains well above its rising 50-day simple moving average (SMA), now near $507. 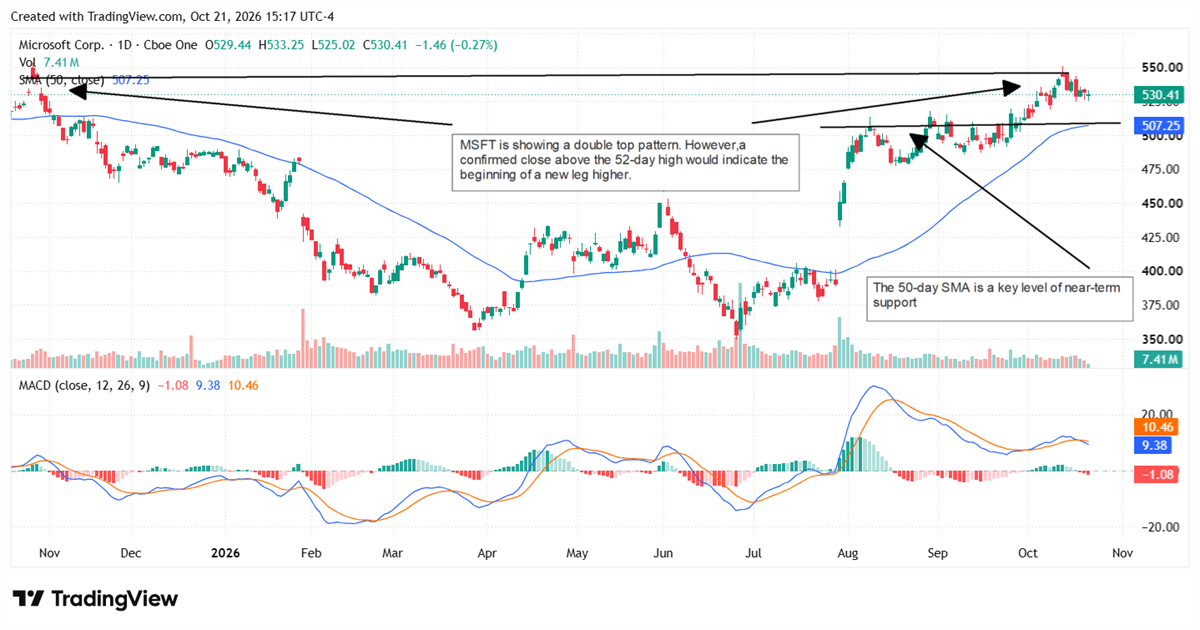
However, the stock stalled near $550 in mid-October. That's close to where it peaked last fall before a long decline. A failure to clear that level would raise the risk of a double top. The MACD indicator adds to the caution. The MACD line has crossed below its signal line, and the histogram has turned negative. MACD also made a lower high in October, even as the stock made a higher high. That bearish divergence suggests buyers are losing conviction. Initial support sits near $515, the top of the August-September trading range. Below that, the 50-day SMA near $507 is the next key level. On the upside, a decisive close above $554 would confirm the breakout. Read this article online › Featured Stories

Did you like this article?  
|






No comments:
Post a Comment