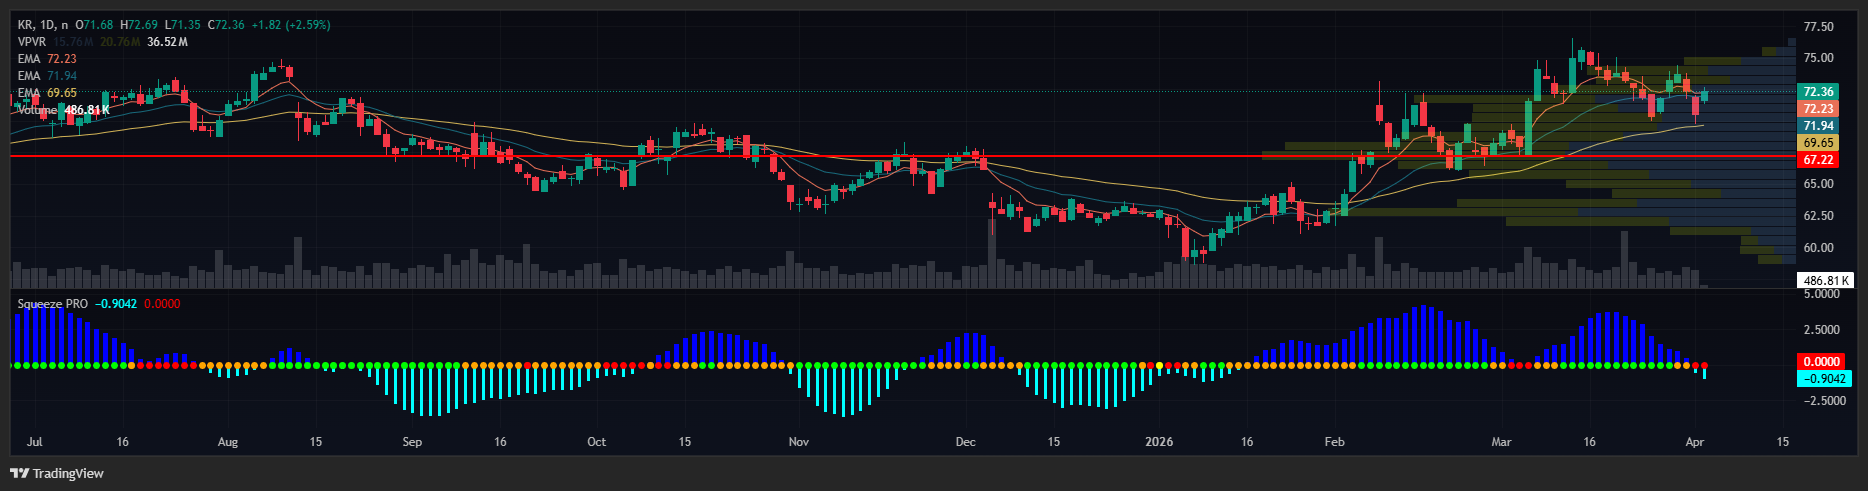
All three have to line up before I pay attention to a setup. Here is where KR stands on each one. Trend: An EMA, or exponential moving average, tracks a stock's average price. It gives greater weight to recent actions than to older data. When the short EMA sits above the long one, that is bullish. When both sit above the 200-period moving average, that is called stacked. It means buyers have been consistently stepping in at higher prices. On KR, the 8-day EMA is above the 20-day EMA. Both are well above the 200 SMA. Stacked on the daily. Stacked on the weekly. Pattern: After running from $62 in January to a high around $76 in February, KR pulled back and coiled just above its uptrend line. A tight consolidation after a strong trend move is exactly what TPS looks for. Today, that coil is starting to release. Squeeze: A squeeze forms when Bollinger Bands contract inside Keltner Channels. Bollinger Bands measure the width of the recent price range. Keltner Channels measure average volatility. When both compress together, volatility has collapsed, and a move is building. The daily squeeze on KR has fired. Today is the first signal. I turned $37,000 into $2.7 million in four years using this system. The setups that produced that result looked a lot like this one. Business is holding up. Trend intact. Pattern coiling. Squeeze fired. Your Action PlanKR is trading at $72.56. The 20-day SMA at $73 is the first level to clear. A clean close above it on volume confirms the move is real. The prior high near $76 is the next target. The 200-day SMA near $68 is the stop reference. If KR closes below that on volume, the setup changes. I do not have a position in KR. This is a watchlist setup, not a trade call. I am watching, not buying. If you want to know exactly when I am trading, check out Daily Profits Live. |


No comments:
Post a Comment