Tuesday, March 17, 2026

This Stock Nearly Tripled Earnings Estimates. It's Setting Up Again.

Trade of the Day Wake-Up Watchlist

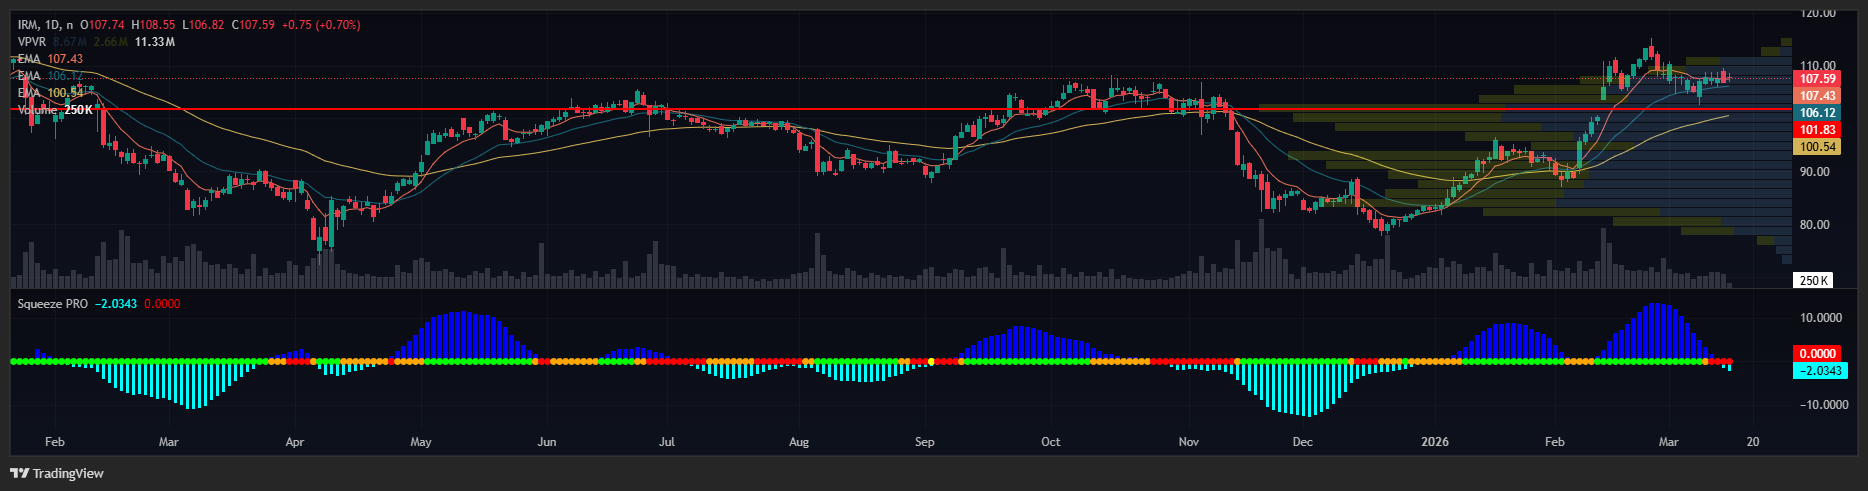
"IRM nearly tripled earnings estimates in February and barely flinched when the market sold off. Now it's squeezing on multiple time frames at once."

Nate Bear, Lead Technical Tactician, Monument Traders Alliance

Nate Bear

Publisher's Note: On Friday, META gave out a specific signal...

Yesterday, shares exploded higher... and some traders in the know made over 100% on the trade.

It's all thanks to a new strategy we're going to share tomorrow at 2 p.m. ET.

We'll show you exactly how it works... and the specific stocks that you can use it on.

Intrigued?

Click here to reserve your spot.

- Stephen Prior, Publisher, Monument Traders Alliance


When the market sold off hard in February, most stocks didn't just dip... they collapsed.

But Iron Mountain (IRM) shot up 14.7%.

That's not luck. That's a stock with something the rest of the market is missing right now - and when I see relative strength like that in a selloff, I pay attention.

I didn't learn to spot setups like this on a trading floor or at a Wall Street desk.

I learned it the hard way - blowing up a $1,000 account, then a $10,000 account, starting over twice.

What I eventually figured out is that you don't need to be right about everything. You just need a repeatable system and the discipline to wait for it to fire.

That system help me turn $37,000 into $2.7 million.

And right now, it's pointing straight at Iron Mountain.

Here's what's going on...

The Fundamental Catalyst

On February 12, Iron Mountain reported Q4 2025 earnings of $1.44 per share. Estimates were $0.59.

That's right. The company didn't beat estimates. It nearly tripled them.

Revenue came in at $1.84 billion - above expectations - capping the company's fifth consecutive year of all-time records for revenue, adjusted EBITDA, and cash flow. Management guided 2026 revenue growth of 10% to 13%.

Management also declared a quarterly dividend of $0.864 per share.

The market rewarded it immediately. The stock ripped from $90 to $115 in a matter of days.

But here's what I find more interesting than the pop itself...

Where the stock went after it.

Why This Stock Holds When Others Don't

Iron Mountain is a REIT - a real estate investment trust. That means it owns physical assets, pays a steady dividend, and moves differently from software stocks or growth names.

Most REITs got punished this year. IRM didn't - because it's not a typical REIT. While other companies are betting on AI models and software platforms, Iron Mountain is building the physical data centers that power them.

Storage vaults, server rooms, and digital records management for 95% of the Fortune 1000.

When the SaaS apocalypse hit, and software stocks lost a trillion dollars in February, institutions rotated out of growth and into assets with real cash flow and real dividends. IRM was exactly where that money went.

That's relative strength. And it shows up clearly on the chart.

What the Chart Is Telling Me

IRM chart
 

SPONSORED

Stock Flip Fortunes LIVE

Stock Flip Fortunes - March18 at 2 p.m.ET
 

Discover How to Make $5,000 Overnight (or MORE!) "Flipping" Stocks for Quick Doubles Again and Again!

Target Gains Up to 224%... 384%... Even 667% in a Single Night...

RSVP FREE for Live Event Wednesday, March 18 at 2:00 p.m. ET

After the earnings pop to $115, IRM pulled back - as stocks always do after a big run. But here's what matters: it pulled back to $105 and held.

Right now it's sitting at approximately $108 with everything lined up.

It has stacked EMAs. The 8-day EMA is at $107.53. The 20-day EMA is at $106.34. Both running below current price, shorter above longer. Think of stacked EMAs like a staircase - each step supporting the one above it.

When a stock holds that pattern, buyers are consistently stepping in at higher prices. The trend is intact.

The 200-day SMA at $96.69 was never seriously threatened during the entire market selloff. That's the long-term trend line most institutional investors use as their floor. IRM didn't come close to it.

The RSI is at 58. The Relative Strength Index measures momentum on a scale of 0 to 100. Above 70 means overbought - run too far, too fast. Below 30 means oversold.

At 58, IRM has room to run without getting stretched.

And then there's the squeeze. This is the part I get most excited about.

A squeeze happens when Bollinger Bands - which measure how wide or tight a stock's trading range is - contract inside Keltner Channels. When that happens, volatility is being compressed.

The stock is building energy for a move, like a coiled spring under pressure. It can't stay that way forever. When it releases, it releases hard.

IRM isn't just squeezing on one time frame.

It's squeezing on multiple time frames simultaneously - daily and across several intraday charts. When I see a squeeze line up on one time frame, I'm interested. When it lines up across multiple time frames at the same time, that's a signal I take seriously.

Multiple time frames firing together means the compression isn't short-term noise. It's building across different groups of buyers and sellers all reaching the same breaking point at the same time.

When that spring releases, the move tends to be fast and sustained.

Stacked EMAs. RSI with room. Multi-timeframe squeeze. The spring is fully loaded.

Your Action Plan

I'm not touching IRM until it clears and holds $110.

That's my potential trigger. A clean close above $110 on volume tells me the consolidation is over, the squeeze is releasing to the upside, and the next leg has started.

The target is a retest of the February high at $115. That's a 6% to 7% move from the trigger.

Just watch the 20-day EMA. If IRM closes below $106.34 on volume, buyers have lost control and I'll walk away clean. Simple as that.

One more thing: next earnings land April 30. A break above $110 in the next few weeks sets up perfectly for another earnings run - the same kind that pushed this stock 14.7% in February.

Add IRM to your watchlist at $108. Watch $110. That's where this gets interesting.

Want to see exactly when I pull the trigger - live, in real time?

Join me every day in Daily Profits Live. I trade this system in front of you, start to finish, every market session.

When IRM fires, you'll know the second I do.

Want more content like this?
Like button Dislike button

SPONSORED

One crucial spike the day BEFORE earnings...

WAR Volume
 

Led to 293% gains... in less than 24 hours!

Best of all... the trade would have worked if the stock surged up...

Or crashed down.

Watch for THIS Spike the Day BEFORE Earnings (Click Here)

No comments:

Page List

Blog Archive

Search This Blog

EXPOSED: The “29% Account”

They've all been using a special type of... Sponsored Content   ...