This guide shows you the exact 15-minute window I trade, and how to spot the same setups the big funds are watching.
It's yours for free.
Thomas Wood
P.S. This isn't a 100-page novel. It's a short, actionable guide you can read in about 10 minutes and put into action by tomorrow morning. Get it here.
Cloudflare (NYSE: NET) is emerging as a potential relative safe haven at a time when broader market signals are turning more fragile. Earlier this month (March 4 to be exact), I stated that the benchmark SPDR S&P 500 ETF Trust (NYSEARCA: SPY)flashed an ominous quantitative signal. Essentially, in the trailing 10 weeks, the SPY ETF had printed seven up weeks, which you would ordinarily deem as an optimistic framework. However, the overall slope from beginning to end was negative, thereby creating what I call a 7-3-D sequence: seven up, three down, downward slope.
Table of Contents
It’s not so much that there's something inherently problematic about this signal in the abstract. Statistically, though, this pattern is extremely rare, having only materialized a handful of times over the last several years. What's more, when this signal flashes, the end result tends to be negative for the SPY.
And so far, that's exactly what we're seeing. Since the close of March 4, the benchmark ETF has lost roughly 2.5%. The significance here is not so much about the raw performance loss but the overall trend. Due to the rising inferno stemming from the Iran war and its implications for global economic stability, the SPY could be the canary in the coal mine.
Still, not all sectors may be due for a steep correction. If I had to be bullish on a sector right now, I'd take a long look at cybersecurity, especially names like Cloudflare. Headquartered in San Francisco, California, Cloudflare provides a range of internet services, including content delivery network services and cloud cybersecurity.
Fundamentally, these specialties should see rising relevance given Iran's cybersecurity capabilities. Also, the Iranian strategy isn't focused on mano-a-mano warfare but rather asymmetric attacks. The bottom line is that no country is going to attack the U.S. head-on. Instead, the point here is to make the war economically unsustainable for the Americans.
That puts U.S. business interests at great risk of cyberattacks, driving relevance for NET stock. Not only that, it appears the smart money has the same idea.
Volatility Skew Goes Bimodal for NET Stock
Easily one of the most important options-related screeners to consider is volatility skew. By definition, the skew identifies implied volatility (IV) — or a stock's potential range of motion — across the strike price spectrum of a given options chain. In effect, the screener showcases the surface-area distortion of volatility space, allowing retail traders to understand the smart money's risk positioning.
If you think about it this way, if sentiment were perfectly neutral for NET stock, the skew would be completely flat. However, the market for popular securities is never like that. Most market participants — especially institutional investors — are worried about downside movements. As such, they may buy put options, which act as an insurance product against corrections.
On the flipside, other participants are worried about missing upside opportunities. In that case, you will likely see traders pay a heftier premium for call options. In turn, the skew on the right-hand side (toward higher strike prices) may rise, suggesting that the smart money is positioning for upside convexity.
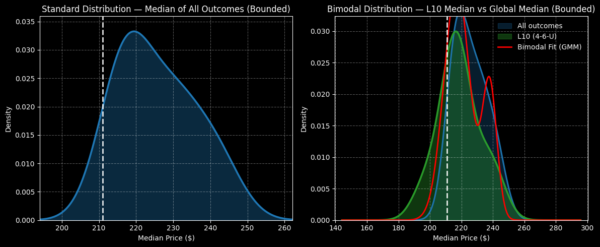
What makes NET stock rather unique is that its skew is bimodal. From the starting gun, put IV rises higher and higher toward the left-hand side (toward lower strikes). This setup indicates a prioritization of mitigating downside volatility. However, on the other end, call IV also rises toward the right-hand side. Here, the structure suggests that traders simultaneously don't want to miss out on any rallies.
It's worth reminding ourselves that the smart money isn't smart because it's prescient. This skew reflects the point. It's obvious that even the most sophisticated players are unsure of where NET stock may head next. But despite the volatility concerns, these folks also don't want to miss out on a potential sustained rally.
Using the Inductive Approach to Trade Cloudflare Stock
While the smart money may not know where NET stock may go next (hence the bimodal skew), a nagging question remains: is there a way to deduce this information? From a purely mathematical sense, the answer is no. Nothing about the current state of affairs necessarily compels a future outcome. However, what we can do is to reasonably infer an outcome.
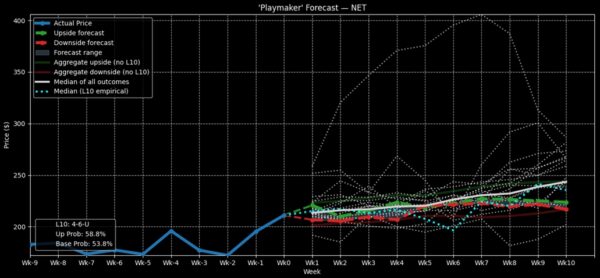
Essentially, we're going to rely on pattern recognition. Here's the deal. In the past 10 weeks, Cloudflare stock printed only four up weeks, but the overall slope was positive. This market structure creates a rare 4-6-U sequence. As alluded to earlier, there's nothing special in the abstract about this sequence. However, it's a distinct signal — and statistically, this setup should yield a distinct distribution.
It's just like baseball. For many players, the batting average fluctuates depending on whether there are runners in scoring position. Some players simply rise to the occasion and their situational batting average reflects this reality. It's the same principle (I believe) in the equities market.
Under 4-6-U conditions, NET stock would have a tendency to land between $175 and $262. To be fair, probability density is expected to peak at around $218 on a median basis. However, this data encompasses an approximation from all examples of the 4-6-U sequence. Fundamentally, I speculate that the current circumstance of the Iran war offers an unusual catalyst.
We're facing a potential paradigm-shifting event that could impose long-standing economic consequences. Further, U.S. business interests will be prime targets for Iranian asymmetric attacks. Given this framework, I don’t think adding some Kentucky windage is a bad idea.
Identifying a Specific Trading Idea
For aggressive speculators, the one idea that I find appealing is the 240/250 bull call spread expiring May 15. This wager requires NET stock to rise through the $250 strike at expiration to be fully profitable. If it does, the maximum payout (at time of writing) comes out to nearly 120%. Breakeven lands at $244.55, helping to somewhat improve probabilistic credibility.
There's no doubt that this trade features a thin wing, meaning that the window of profitability is narrow. In order for this trade to work, we would be aiming for the security's high point (which flashed on Halloween). While an aggressive target, the combo of fundamental and quantitative evidence arguably makes NET stock intriguing.
This is a PAID ADVERTISEMENT provided to the subscribers of StockEarnings Free Newsletter. Although we have sent you this email, StockEarnings does not specifically endorse this product nor is it responsible for the content of this advertisement. Furthermore, we make no guarantee or warranty about what is advertised above.
Your privacy is very important to us, if you wish to be excluded from future notices, do not reply to this message. Instead, please click Unsubscribe.
StockEarnings, Inc 33 SE 4th St, Suite 100, Boca Raton, FL 33432 USA W: 877.6.STOCKS StockEarnings.com


No comments:
Post a Comment