"These setups print triple digits—but only if you wait for the trigger. Rush it and you bleed. Time it right and you bank." Nate Bear, Lead Technical Tactician, Monument Traders Alliance Publisher's Note: The market keeps trying to break down... but it won't actually break. The Nasdaq 100 can't seem to close below $600. That behavior isn't random — and CJ's breaking down exactly what it means TODAY at 2 pm ET during Monument Traders LIVE. He'll cover why certain stocks are bouncing immediately after one-day selloffs, whether now's the time to buy, and take your questions live. Click here to join Wednesday at 2 pm ET — Stephen Prior Publisher, Monument Traders Alliance
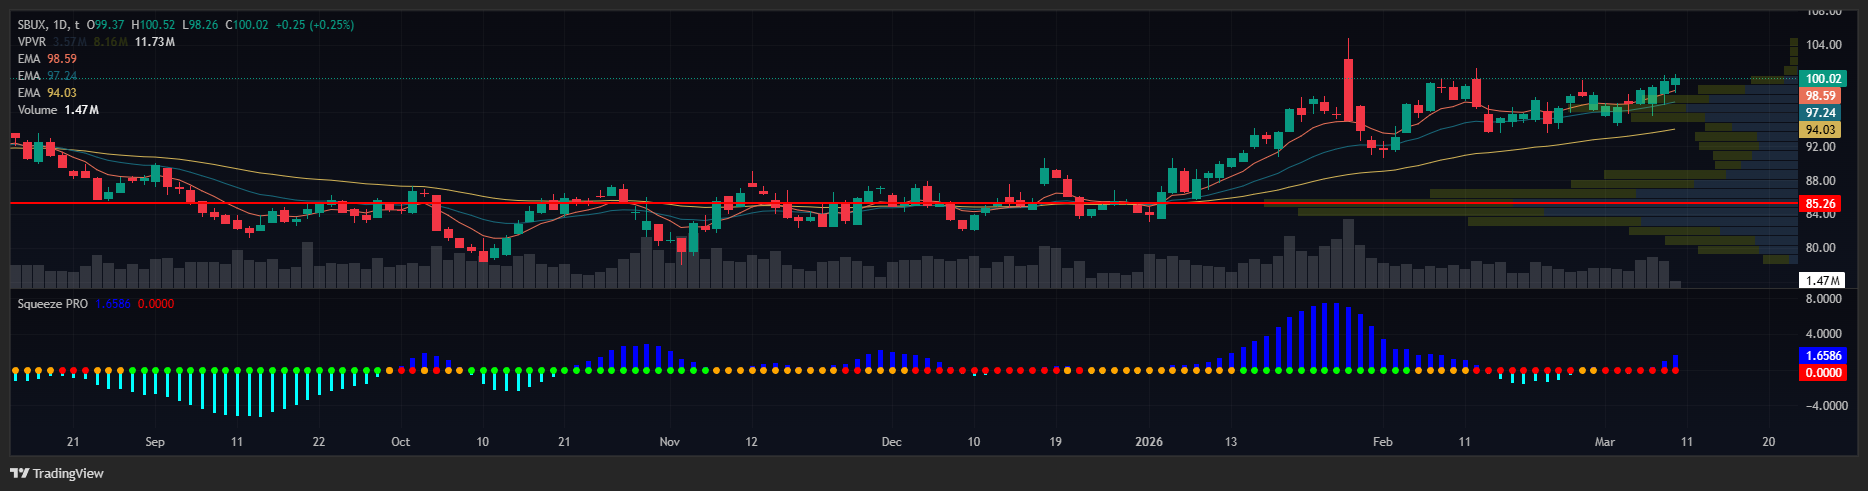
Starbucks is setting up one of the cleanest earnings plays I've seen this quarter. Five timeframes. All showing the same squeeze pattern. And yet I'm not touching it. Here's why — and what I'm waiting for before I pull the trigger. When Multiple Timeframes Align I'm seeing squeezes on five different timeframes: daily, 195-minute, 130-minute, 78-minute, and 60-minute charts. If you're not familiar with squeezes, think of them like a coiled spring. When Bollinger Bands contract inside Keltner Channels, volatility is compressed. The market's building energy for a move. When I see this pattern across multiple timeframes? That's not a coincidence. That's the market telling me something big is coming. With SBUX reporting April 28th, we're looking at perfect timing for volatility expansion. Daily squeezes into earnings are money-makers. The Technical Foundation SBUX has stacked EMAs on the daily chart - shorter moving averages layered above longer ones, creating persistent buying pressure. Stacked EMAs + squeeze setup = a stock that wants to move higher but is building pressure for release. The 20-day EMA sits at $97.37. That's my key level. In squeeze plays, how price reacts here tells me which direction the explosion goes. Reading Relative Strength | 


No comments:
Post a Comment