Dividend Yield REITs | REIT Name | Dividend Yield |
|---|
Bridgemarq Real Estate Services (BREUF) | 9.9% | Gladstone Commercial Corp. (GOOD) | 11.2% | Community Healthcare Trust (CHCT) | 11.6% | Chimera Investment Corp. (CIM) | 11.9% | AGNC Investment Corp. (AGNC) | 13.4% | Dynex Capital (DX) | 14.7% | Innovative Industrial Properties (IIPR) | 16.0% | ARMOUR Residential REIT (ARR) | 16.3% | Ellington Credit Co. (EARN) | 18.3% | Orchid Island Capital Inc. (ORC) | 19.9% |
| Source: Sure Dividend | Amid market turmoil, investors seeking high-yield income are drawn to ads featuring eye-popping dividend yields like 19.9% that dwarf traditional fixed income. There is a saying on Wall Street: if it looks too good to be true, it probably is. | We analyzed yield income over the last five years for several high-dividend-paying REITs. Instead of delivering sustainable income, most REITs operate as classic dividend traps, luring investors with headline yields while steadily destroying capital beneath the surface. |
|
| | | | | Wall Street Legend Issues Chilling New Warning: "I've Never Seen Anything As Dangerous As This" | | The man who predicted the 2008 crash and 2020 says today's soaring markets are NOT a bubble - they're something far stranger and more dangerous. He says it's about to change everything you know about money. | Full story here |
| |
| | |
| What is a Dividend Trap? | Dividend traps are investments in which high dividend yields mask fundamental business problems. You get your dividend checks, sure, but your account balance keeps shrinking. You might earn 15% in dividends but lose 20% in share value. Result: net losses despite income payments. High yield often signals danger, not opportunity. |
|
| | The Illusion of Income | Let's start with simple math. If an investment offers a 15–20% yield, the market is signaling very high risk. These investment vehicles have either deteriorating fundamentals, unsustainable payout ratios, or both. | Take Innovative Industrial Properties, for instance: the REIT sports an exceptional 16% yield. While dividend checks arrive every quarter, shareholders have watched their investment decline nearly 13% historically. The case is similar for Community Healthcare Trust, which tells a comparable story: an 11.6% yield accompanied by an 8.5% capital loss. Investors collected income with one hand while losing principal with the other. None of these funds managed to generate more returns than the S&P 500 index (See Image 1). | 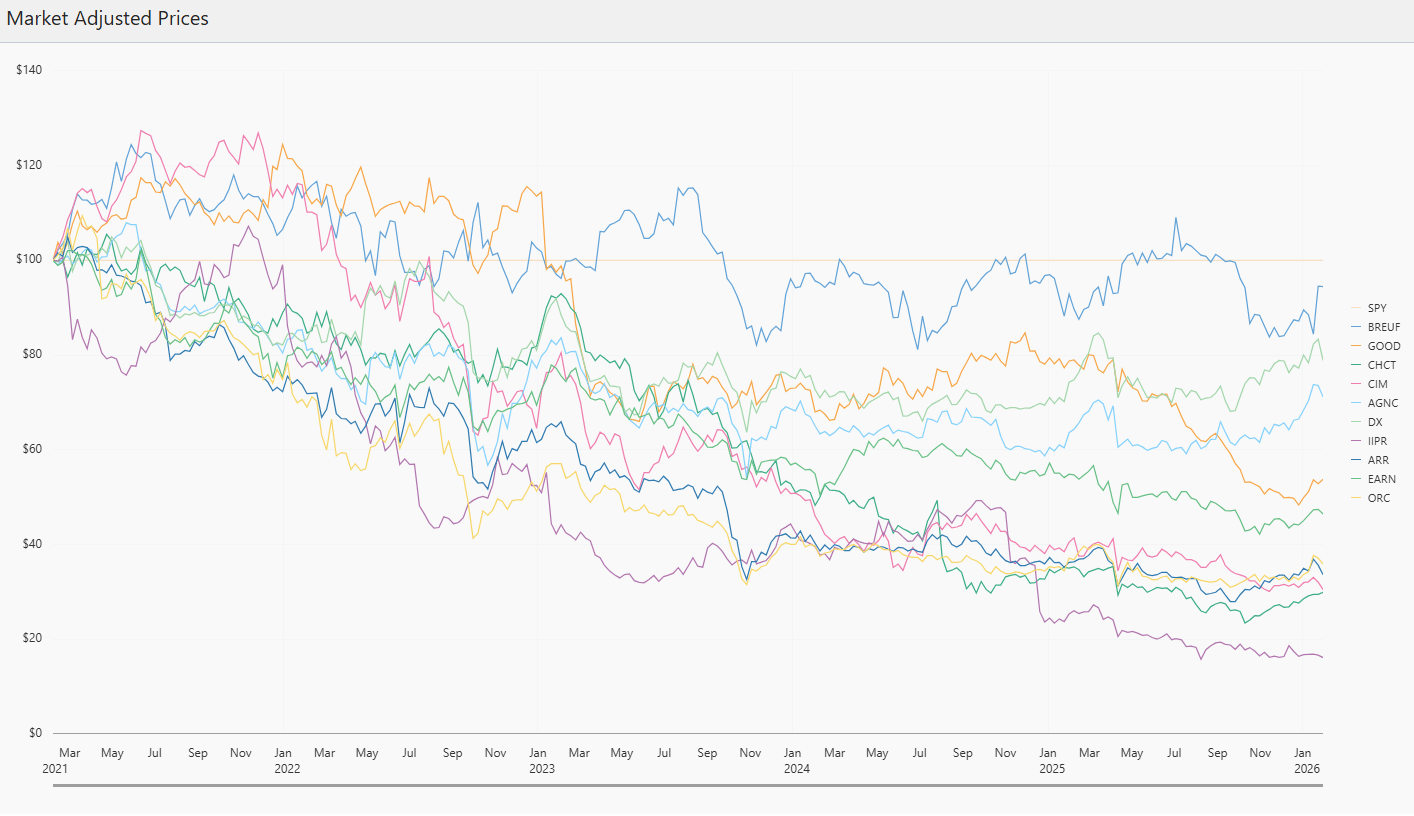 | Market Adjusted Returns |
| Chart compares the market-adjusted returns of selected high-yield REITs against the S&P 500 (SPY), showing most of the REITs experience persistent underperformance and steady capital erosion, with brief rebounds failing to offset longer-term declines. |
|
| | Volatility: The Hidden Cost | These REITs are far more volatile than most investors realize. The S&P 500 moves around 16% annually, but these high-yield REITs swing between 24% and 41%. For retirees counting on a steady income, this creates real problems. Sure, the dividend checks arrive on schedule, but the account value bounces around wildly. You might collect your 15% yield while watching your portfolio drop 30% in a few months. That's not what "income investing" is supposed to feel like. |
|
| | Beta and Alpha: A Losing Combination | Risk-adjusted metrics illuminate fundamental portfolio unsuitability. Beta dispersion (0.51–1.34) suggests varied systematic risk exposure, yet alpha generation remains consistently negative across the universe. This indicates manager- or security-specific underperformance independent of market sensitivity. | Alpha reveals the critical insight: negative alpha means underperformance even after accounting for risk taken.IIPR's -29.6% alpha indicates it lost nearly 30% more than expected given its risk level. CHCT's -20.4% shows similar patterns. |
|
| | Correlation | One might argue that these REITs offer diversification benefits. The correlation analysis suggests otherwise. Most names show moderate to high correlation with equities (0.42–0.61 with SPY), undermining their defensive positioning. Some REITs, such as AGNC, DX, ARR, and ORC, exhibit correlations exceeding 0.75 with one another. | Ticker | Correlation with SPY | Historical Volatility | Historical Return |
|---|
SPY | 1.000 | 15.93% | 14.25% | BREUF | 0.336 | 24.08% | 10.27% | GOOD | 0.536 | 24.54% | 2.12% | CHCT | 0.423 | 29.55% | -8.48% | CIM | 0.602 | 35.36% | -1.69% | AGNC | 0.565 | 28.03% | 10.08% | DX | 0.533 | 23.99% | 9.41% | IIPR | 0.476 | 40.76% | -12.95% | ARR | 0.544 | 31.18% | -3.29% | EARN | 0.609 | 26.60% | 1.35% | ORC | 0.506 | 31.68% | -2.38% |
|
|
| | When They Might Actually Work | Despite structural deficiencies, these securities exhibit limited tactical utility during specific market regimes. In acute equity drawdowns characterized by dividend reductions and credit spread widening, high-yield REITs may provide interim income while maintaining partial equity exposure. | The keyword is temporary. These positions work best as three-to-six-month holds during market dislocations, not as buy-and-hold income generators. Their elevated yields can cushion portfolio declines in bear markets, and their moderate equity correlation means they sometimes lag on the downside initially. |
|
| | The Bottom Line | Ultra-high yields are warnings, not invitations. These REITs combine dangerous volatility, consistent underperformance, and wealth destruction, making them toxic for income portfolios. They might work as very short-term crisis trades, but for 99% of investors, 99% of the time, they're a trap. | If you actually want income or diversification, buy quality REITs yielding 4–6% with strong financials and growing businesses. Boring? Maybe. Profitable? Absolutely. |
|
| | | | | Important disclosures: This newsletter is provided for informational purposes only and does not constitute investment advice. All investments involve risk, including possible loss of principal. Please consult with your financial advisor before making investment decisions. |
| |
| | |
|
|


No comments:
Post a Comment