Spot prices tell you what just happened—the futures curve shows where supply, demand, and real money are actually headed
Imagine you're at a farmers' market, and apples are $3 per pound today. But if you ask the farmer what apples will cost next month after harvest season, he says $2 per pound. That price difference tells you something important: there's going to be plenty of apples soon. Commodity futures work exactly this way. When future prices are lower than today's price, the market is saying "supply is coming." | When you plot all these prices on a chart, you get a curve that tells you what the market really thinks is happening. Is supply getting tighter? The curve goes up. Will there be a glut? The curve goes down. Understanding this curve is way more valuable than obsessing over whether oil is at $55 or $60 today. | The curve is the market's working model. Spot is just the latest print. |
|
| | What the Curve Actually Tells You | The futures curve links prices for different delivery dates. When forward prices sit above spot, the market is in contango. When front-month contracts trade higher than back months, it's backwardation. | |
|
| | | | | Everybody Wants To Know | How does Tim Sykes profit over the weekend? | It sounds impossible. | But when I show you how I'm making thousands of dollars almost every weekend like clockwork… | By just placing one simple trade around 2:59 pm on Friday… | You're going to be SHOCKED. | | Click here to discover my best trading secret. | "Results are not typical. I teach methods that have made other traders money, but that does not guarantee you will make any money. Success in trading requires hard work and dedication. Past performance does not indicate future results. All trading carries risks." | -Tim Sykes |
| |
| | |
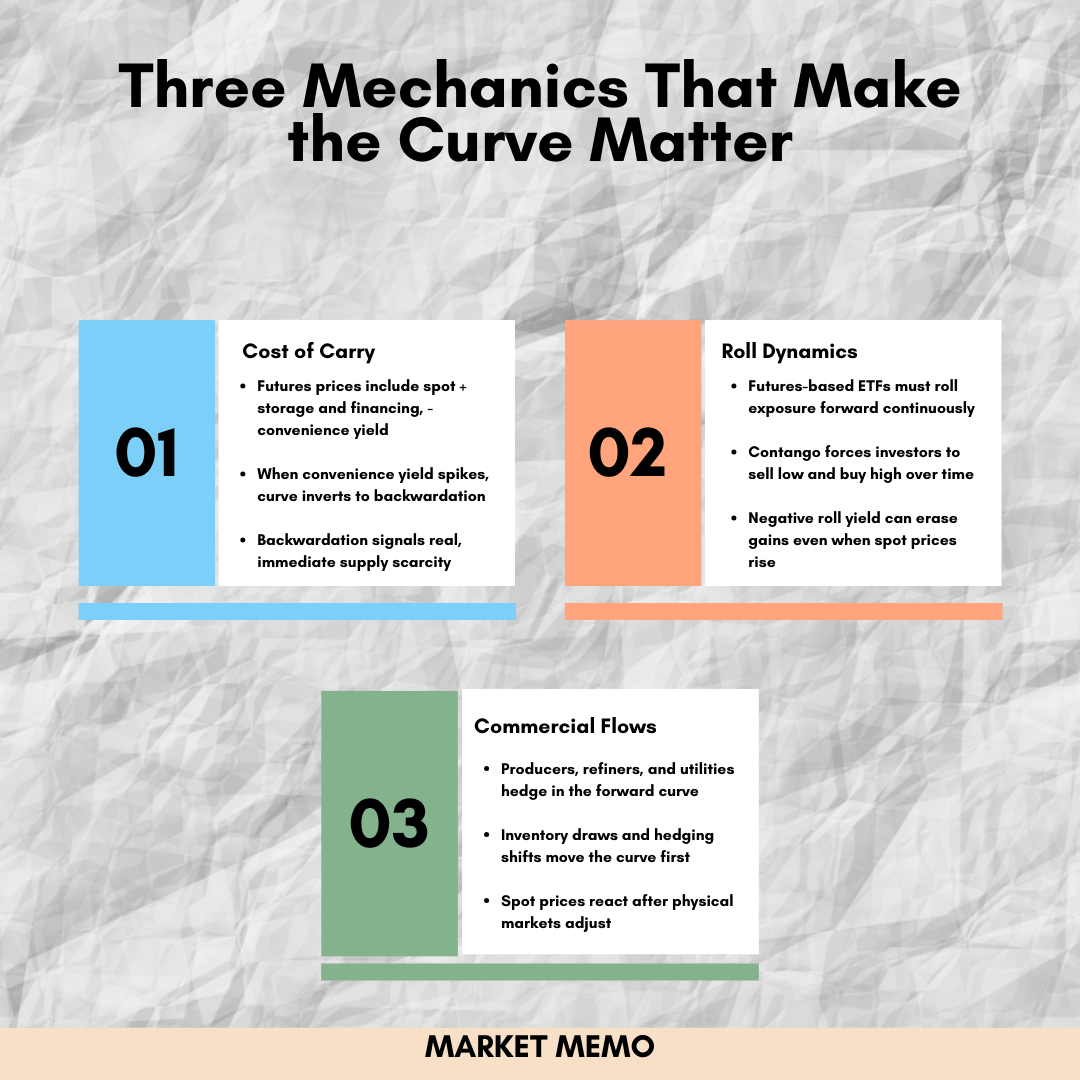
| Three Mechanics That Make the Curve Matter | |
|
| | What to Watch Every Week | Every week, you should track spot prices vs. the 12-month spread for key commodities like oil, gas, and copper. If there is a large positive spread (a.k.a., backwardation), it signals a genuine physical tightness. Flat or negative spreads (a.k.a., contango) suggest adequate supply or weak demand. | You should also watch commercial positions and inventory reports, e.g., EIA weekly oil and gas storage data. The curve moves with commercial flow not with retail sentiment. | Use roll-adjusted returns when evaluating funds or backtests, not spot returns. Roll mechanics hurt or help performance depending on the curve structure. Ignoring this creates false performance expectations. |
|
| | What Not to Do | Don't confuse a short-lived spot spike with a structural squeeze. If the curve stays flat or in contango while spot jumps, that spike is likely driven by positioning or headlines, not fundamental scarcity. | Don't buy long-dated flat-price exposure through ETFs without checking the fund's roll strategy. You might be buying negative roll yield that quietly erodes your position even as the commodity itself rises. |
|
| | How the Pros Trade It | Calendar spreads: Buy front, sell back when you expect immediate tightening (playing backwardation). Or reverse when you expect contango to deepen. Hedged carry trades: Capture positive roll yield from backwardation while hedging directional market exposure. Options on spreads: For asymmetric payoff to sudden backwardation or curve steepening without taking full directional risk.
| The CME publishes solid primers on spread strategies if you want to go deeper into the mechanics. |
|
| | The Bottom Line | Spot prices are what CNBC shows. The futures curve is what traders actually use to make decisions. | If your commodity analysis starts and ends with the spot price, you're trading a story—not the market. The curve encodes supply, demand, storage, and commercial behavior in real time. It's the market's forecast and its risk meter. | Start every commodity call by looking at the curve shape, roll dynamics, and commercial positioning. That separates cheap luck from repeatable edge. |
|
| | | | | Important disclosures: This newsletter is provided for informational purposes only and does not constitute investment advice. All investments involve risk, including possible loss of principal. Please consult with your financial advisor before making investment decisions. |
| |
| | |
|
|
| | | | Update your email preferences or unsubscribe here © 2026 Market Memo 228 Park Ave S, #29976, New York, New York 10003, United States | | Terms of Service | |
|
|
|
|
|


No comments:
Post a Comment