| DAILY ISSUE How to Find the Best Days to Buy — Down to the Date VIEW IN BROWSER
Human progress didn’t start with better tools. It started with better timing. Early humans paid close attention to repeating patterns in nature – the length of days, the return of floods, the timing of animal migrations. Those observations gave rise to the first calendars – sometimes recorded in stone and often anchored to the predictable cycles of the sun, moon, and stars. This helped early farmers decide when to plant and harvest crops, and helped hunters know when herds would pass through a region. These cycles didn’t explain why things happened. They explained when things happened. And that knowledge was enough to plan around. And when it comes to humanity’s long fascination with cycles, few monuments are as widely studied as Stonehenge in southern England. 
Stonehenge, a prehistoric monument near Salisbury in southern England Built about 4,500 years ago in several phases, Stonehenge is among the best-known prehistoric monuments. One enduring theory about Stonehenge rests on its alignment. Its main axis points toward the sunrise on the summer solstice. That’s led archaeologists to argue that Stonehenge was designed, at least in part, to mark key points in the solar year – signals that would have helped early societies anticipate seasonal change in a world where timing meant survival. Building a monument like this likely required generations of careful observation, tracking the sun’s annual path using little more than fixed landmarks and sightlines. Today, we don’t need to build huge stone structures to detect patterns that can help us thrive. We have more detailed data at our disposal and a lot more analytical power to help us put it all together. At TradeSmith, our mission is to give everyday investors access to the kinds of data and analytics once reserved for hedge funds. That work has led us to uncover a feature of the market that’s often overlooked: seasonality in stock movements. You can’t see these cycles with the naked eye. They only show up after you run decades of data through powerful algorithms to look for them. But once you do, a surprising picture emerges. Thousands of stocks have historically reliable windows – specific times of year when they tend to rise and others when they tend to fall. That includes bull and bear markets, manias and panics, wars, pandemics, and more. And I’m proud to say that, at TradeSmith, we’ve developed cutting-edge software to track those patterns. We’ve also created a rapid-fire trading strategy based on these signals that can pinpoint bullish seasonality windows on 5,000 stocks – to the day. In our backtests, the system’s trades have won with 83% accuracy. You can try it yourself right now to see the “green day” for 5,000 different stocks when you register for our Prediction 2026 event, which airs next Tuesday, January 20, at 10 a.m. Eastern. During that event, we’ll explain exactly how this works, including a new way to apply this secret in a model portfolio that’s turned every $10,000 into $85,700 in our backtests. Then read on for more on the seasonality phenomenon in markets and how, over the last 15 years, some stocks have followed their seasonality windows with 100% historical accuracy. | Recommended Link | | | | Louis Navellier isn’t known for making scary predictions. He’s managed over $7 billion and has one of Wall Street’s best track records. He’s built his career on careful, fact-based advice. That’s exactly why his urgent warning about what’s really happening in America’s economy demands your attention. He’s created what he’s calling “The Mar-a-Lago Manifesto” — a complete breakdown that explains what’s happening, why it matters to you, and most importantly, the exact steps you need to take NOW for the best shot at protecting yourself and your family. Click here to watch his urgent message now. |  | | Seasonality Affects Markets, Too Commodity traders, for example, have long tracked planting and harvest cycles in crops like corn and wheat. Energy traders watch seasonal demand shifts tied to winter heating and summer cooling. The gold market has recurring seasonal tendencies, often strengthening during certain parts of the year tied to jewelry demand, central bank buying, and annual festivals in India and China. And stock investors have studied phenomena like the January Effect for decades. Even Wall Street’s old saying – “Sell in May and go away” – comes from observed seasonal behavior, not theory. But we’ve discovered that seasonality doesn’t just apply just to commodities and the big stock market index. Every stock has its own seasons to rise or fall – a kind of summer and a kind of winter, too – year after year. Big-box retailer Target (TGT) provides a good example. As one of America’s largest retailers, this stock moves with the rhythms of consumer spending throughout the year. But for all the money won – and lost – on Target over the last few years, there’s one certainty... Between June 22 and July 21, you want to buy the retail bellwether. Target has moved up an average of 5.2% during that summer period, rising 100% of the time over the past 15 years: 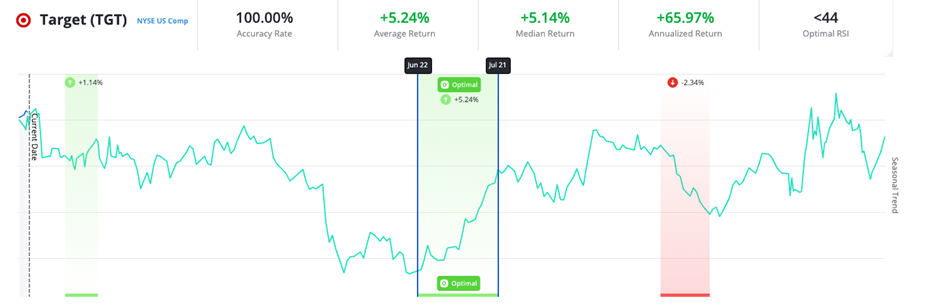
That’s 15 years of summertime price spikes, starting long before it fell under the pandemic-era spotlight. And in 2025, the pattern held true: Target rose 10.3% during its 29-day seasonally bullish window. The chart you’re seeing above is from one of the breakthrough innovations from TradeSmith’s team of researchers, software engineers, and quant investors: our ground-breaking Trade Cycles Seasonality tool. It’s an easy-to-use tool that can take one of thousands of commonly traded stocks, analyze its movements, and point out its strongest seasonality trends – with starting periods narrowed down to the day. Here’s another example of a strong seasonality pattern, this time in Home Depot (HD): 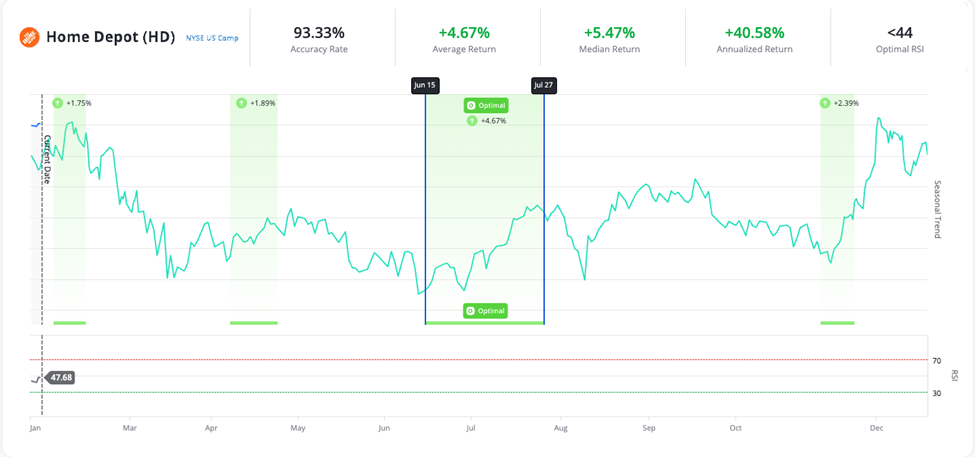
Over the last 15 years, between June 15 to July 27, Home Depot’s share price has risen 93% of the time, with an average return of 4.7%. And in 2025, the pattern held true again. It rose from $349.31 on June 16 to $372.69 on July 28 – a 6.7% gain in a just over a month. A Powerful New System for Seasonal Profits Target and Home Depot are just two examples among many others. Our development team has fine-tuned this tool to uncover seasonality cycles in stocks, stock market indexes like the S&P 500 and the Nasdaq, as well as in currencies and commodities. By crunching the data and compiling the historical movements of thousands of different assets and running 50,000 tests a day to analyze every stock in the major indexes, we’ve built a new system to help predict the biggest jumps on 5,000 stocks. Over our 18-year backtest, these seasonal trades delivered 857% in total growth. That’s more than twice what the S&P 500 delivered over the same time. Even in 2007, the worst year in our testing, we saw an average gain of 2.5% and an annualized return of 37.9%. That’s close to four times the average annual gain of the S&P 500. 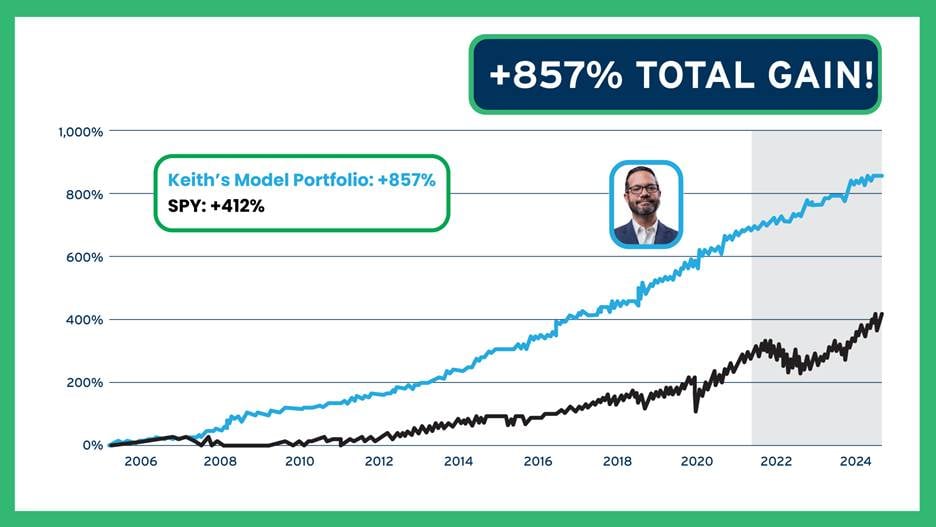
The question now: How can we make this powerful system work for you? The Power of Seasonality Is Now in Your Hands Go here to register for access to an “unlocked” version TradeSmith’s ground-breaking Seasonality tool. Then you can explore the results of our powerful research for the stocks you own or are thinking of buying. It’s available online until next Monday, January 19. Then on Tuesday, January 20, at 10 a.m. Eastern during our Prediction 2026 webinar, I’ll show you how our Seasonality tool can help you find the best time to buy and sell a stock – down to the day. And as we start the New Year, a new batch of these seasonal cycles is about to kick off… And we’ll be sharing unfiltered access to the Seasonality tool and the top seasonal recommendations this year as part of our Trade Cycles trading advisory. Go here now to register for the event – and give TradeSmith’s Seasonality tool a try, free of charge, before the big event. I hope to see you there! 
Keith Kaplan
CEO, TradeSmith | 


No comments:
Post a Comment