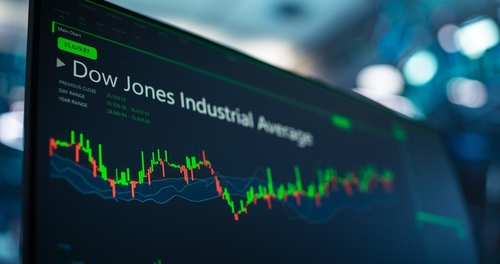
This ONE chart is all you need People are always asking me in The War Room... "What happens if this news item comes out?" Or... "What happens if this person has information that this person doesn't have?" My answer is always the same... Every single piece of information available at any given time in the world is all reflected in the Dow Jones Industrial Average chart. By looking at the Dow chart above, you know everything by reading those candles. And when you know how to turn former resistance into new support - you can essentially decode every piece of information in the entire world at any given time. It's a lifelong skill... It's rare... But those who have it tend to be very, very wealthy on any given market day. Why the Dow is the best market indicator Some will say "the Dow isn't as good of an indictor as the S&P 500 because it's not tech-weighted." But that's not exactly true. Here are a few of the 30 companies listed in the Dow... - Apple (APPL)
- Amgen (AMGN)
- 3M (MMM)
- American Express
So right there - you already have two major tech stocks in APPL and 3M. The Dow also has Boeing, Caterpillar, Coca Cola, IBM, JPMorgan, Microsoft, and Nvidia. Those last two companies alone are two of the biggest tech groups by market cap. Plus, unlike the Nasdaq, the Dow is the broadest example of the 30 most powerful companies in the entire world. It offers more exposure to industrials, energy, and banks - unlike the Nasdaq which doesn't possess any of those sectors. Where economists often go wrong It can be tempting to listen to economists for market insight because they have all the data. But the truth is economists are often behind the curve. That's because economists are backwards thinking. But the market is forward thinking. Take the Federal Reserve, for example. You might hear traders say... "The Fed is behind the curve." That's because the Fed is dealing with monetary policy that's backward looking - against a market forecast that's forward looking. When you have this "oil and water" mix, they're never going to get it straight. So while economists are helpful for data - they're not a good indicator of what the market is going to do in the future. YOUR ACTION PLANThe concept of polarity and using data to our advantage are just a few ways JC Parets is helping traders navigate the current markets. I was captivated by his demonstration, and I'm looking forward to learning more next week. Here's how you can sign up for JC's next event for free today... On Wednesday, May 7 at 2 p.m. EST, JC Parets will be going live with our Lead Technical Tactician Nate Bear for our "2025 Smart Money Portfolio Booster-Pack" event. During this session, JC and Nate will walk you through powerful technical indicators to add to your trading arsenal. If you've been struggling to trade the volatile markets with confidence, this event will be huge for you. Click here to sign up for FREE today.
| 


No comments:
Post a Comment