The slow bleed of the Nasdaq's pullback could be a cause for concern, though
 | Is it Time to Buy the Dip on Tech Stocks
|
| Last week, I covered the S&P 500 Index (SPX) and its 5% declines. Yesterday, that pullback deepened to 10%, officially entering correction territory. In my previous article, I included data on how the index historically performed after such declines. This week, my focus shifts to the Nasdaq Composite Index (IXIC), which has been in correction territory since last week. Unlike the S&P 500, the Nasdaq is more volatile and tech-heavy, containing nearly 3,000 stocks compared to the S&P's 500.
Nasdaq After Corrections
Historical data suggests that IXIC corrections have often been buying opportunities. After a 10% pullback, the index has averaged a 3% gain over the next month, with 78% of returns positive -- far better than its typical 1.1% gain and 63% positivity rate for the same timeframe since 1990.
The real sweet spot comes three to six months after a correction signal. Six months post-correction, the IXIC has averaged a 16% gain, with 78% of returns positive. When the index moved higher over that period, the average return was over 23%. Notably, in 18 of the 23 corrections since 1990, the IXIC never fell into bear market territory (-20%) before reaching a new all-time high. | 🚀 One Stock Pick Could Change Everything in 2025 What if one stock pick could define your success next year? Get 10 expert-vetted stocks set for 2025—plus 5 bonus picks to watch now. Access the full list before these stocks take off! >> | 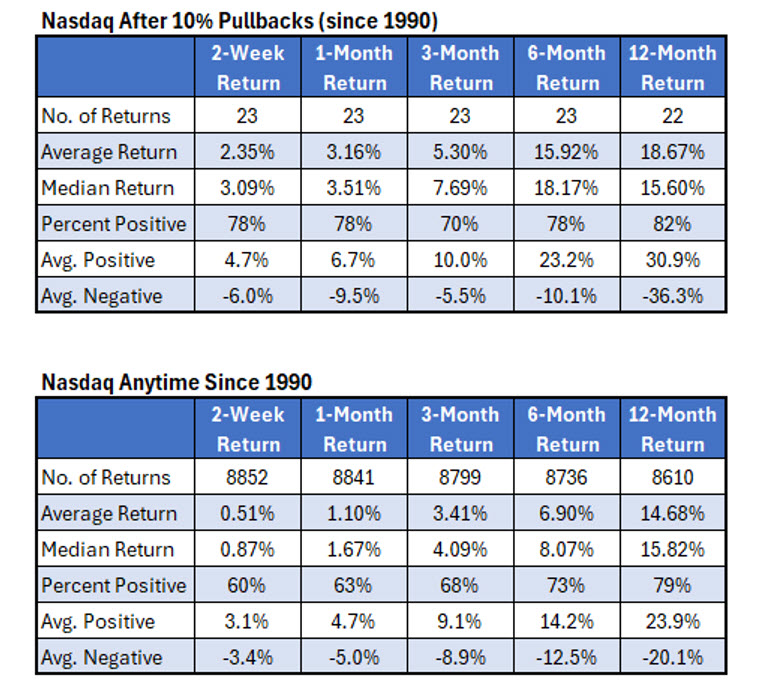 | Slow Bleed vs. Violent Pullback
This latest correction has been unusually drawn out, taking 51 trading days to reach the 10% decline -- the longest stretch among all 24 historical pullbacks.
Historically, faster corrections (20 days or less) tend to produce stronger short-term rebounds, averaging a 3.1% gain over the next two weeks, with 92% of instances positive. Slower corrections, like the current one, see more muted short-term bounces, averaging a 1.3% gain with 60% positivity.
However, over longer timeframes, slower pullbacks tend to outperform at the one-month and one-year marks, while faster declines lead to better three- and six-month returns.
With the IXIC's longest correction build-up in history, it remains to be seen whether this drawn-out decline will follow its historical pattern of stronger long-term recoveries. | Adam Mesh's #1 option trade to make in this market (ad) Everything Mesh is doing right now is around options because they're working so well right now. In his one (and only) service, MeshPrime, the majority of my trades have been winners no matter what the market's doing. Get FREE Training + 2 FREE Weeks of Trades Now! (ad) | 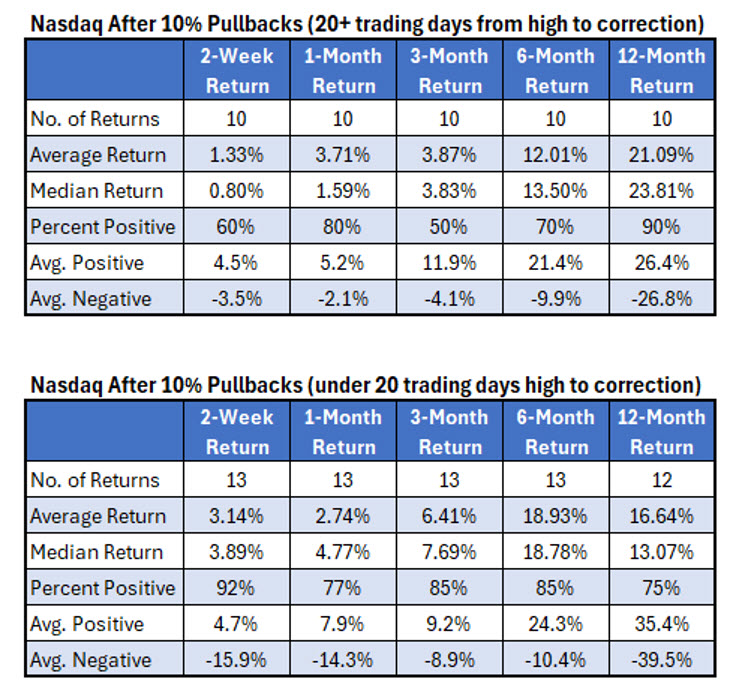 | | | | |
|
| | |
|
|


No comments:
Post a Comment