
Here is the perfect way to start this wonderful trading day. Know and remember there are 3 steps that will create a perfect option-trading life:
Think about your dreams as if they are already a reality. Talk about your dreams as if they are already real. Behave and live life as if these things have already happened and have come true.
Before long, you will look back and say, “Wow, when did that happen?” You’ll then realize your perfect life has been wonderful before and after the actuality of being a super option-trader.
Here’s What Is Covered Below:
- What are Support and Resistance Levels?
- What information do they share?
- How to use that information?
- What happens next?
Today, we are going to discuss Support and Resistance levels. I often call them ceilings and floors. Those are my terms, in the trade industry they are referred to as peaks and troughs. They are created by high and low turning points.
An example, price rises and then, turns and drops creating a ceiling level or peak or price drops to a low, creating a floor level or trough. Let me post a chart to illustrate.
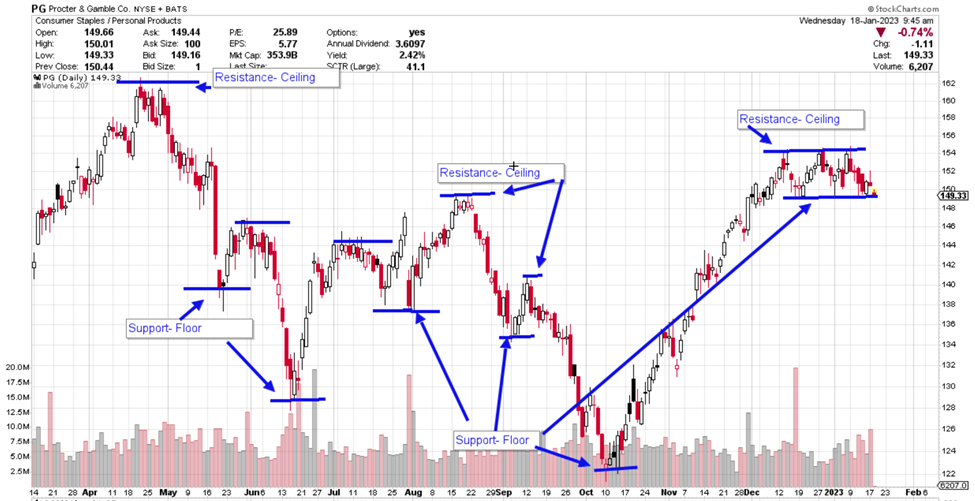
This concept is pretty easy to understand. Price rises to a point and then, it stops as if it hits its head on a ceiling. This level then creates a barrier that can be hard (not impossible) to get through in the future. Often, it can rise and hit its head on this level and pull back again until it finally drops more to regain its strength to eventually try again. Look at the Resistance on left side in April. It touched and tried this area about 6-7 times before pulling way back.
As mentioned, Support is like a floor. Price drops to this level, can’t seem to go lower, no matter if it tries several times, and then, it rises.
Price then often rises to a past support level or new ceiling to try to breakthrough.
Quite often it is as if it hits its head and can’t rise any further and pulls back. It takes several attempts unless the movement is super strong.
What causes support and resistance is traders who were involved in trades. Perhaps, they bought an equity, it hit a resistance level and pulled back. The trader says, “I am going to hold this stock until it gets back to that level and then, I will sell so I haven’t lost any money, whew”. Other traders who perhaps, bought at the low know it is apt to be hard to break through that level, so when it gets close, they sell, and say, “Thanks very much. I am off to trade something new.”
I also think of Support and Resistance as memory levels. Price gets to those levels and remembers it was a stopping point from the past. Sometimes, it will ultimately breakthrough, but often it struggles, so these levels are something to be conscious of and to anticipate that there could be issues when it reaches this level again.
Let’s look at another chart.
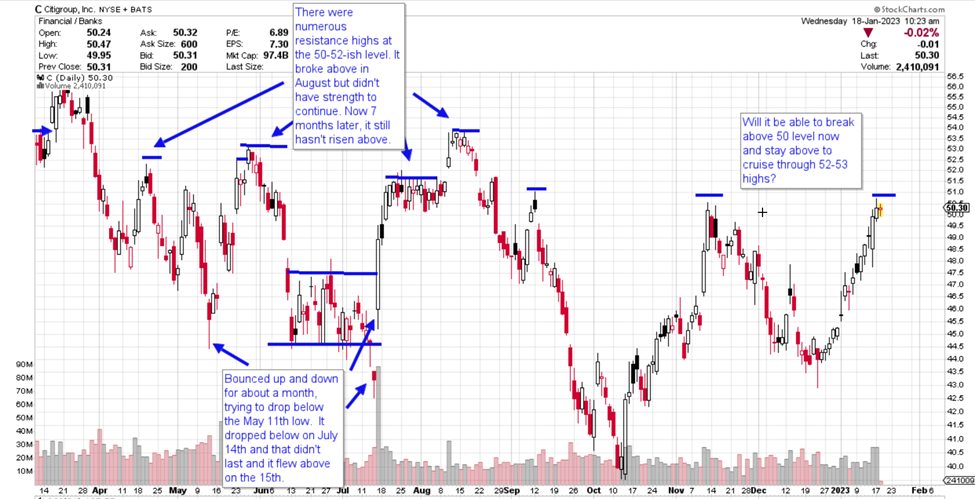
Once you become aware of these ceiling and floors, when you look at a chart, they jump out at you. There is no 100% rule of what is going to happen when price gets close to a level, but you are alerted to watch more closely, knowing that price may stop moving at this level. It could be a place to take profit.
These levels are indicators that tells a story of what has happened in the past and may be repeated in the future.
Note how past support levels (level of a drop) become overhead resistance in a future move. Is price strong enough to rise above this level now? My mind always draws pictures or tells stories.
Perhaps, it says, look price rose and broke through to the 3rd floor of an apartment building, then suddenly, it tries but can’t go any higher. It drops back down to 2nd floor apartment and then, back down to the first floor apartment level. When it eventually decides it is strong enough to rise, the floor of the second story is there overhead again and perhaps, because of the earlier break-through, the floor has been repaired and seems even stronger than before. It takes great effort to get back through- if it happens at all until a later date.
If it does rise and breakthrough, price then rises a bit and often comes back to floor level to test its strength to see if indeed that floor is strong enough to hold. If it is, then it will rise further until it comes to the 3rd floor again and it will try to push through. Does it happen? It certainly will try. Perhaps, it will be successful or will pull back again to try again.
Being able to spot Support and Resistance levels makes you feel like a mind-reader since you have a real hint as to the areas price will struggle, push through or stop.
My goal is to teach everyday people (like me) to successfully trade options. I do my best to write in an understandable way as if we are talking while sitting on the deck of my house in a relaxed atmosphere.
The trading tools you select, and use are important, and can make your trading easier and more effective.
In a sense, life is pretend or what we can visualize. It is based on what we “know” to be true for ourselves at this time, at this moment.
So, in this moment, let’s pretend and “know” we are healthy, really smart, wealthy, super kind, thoughtful…. which are true or will become true, right after we quit pretending we not those things.
Have a great weekend.
And I wish you the very best,
Wendy

See Related Articles on TradeWinsDaily.com
Using Support And Resistance To Enter And Exit Profitably
Built-in 52.9% Profit Potential for ROKU?
Debt Ceiling Struggle Creates Potential Trades
Chart of the Day: Short the Dow
© 2022 Tradewins Publishing. All rights reserved. | Privacy Policy | Terms and Conditions | Contact Us
The information provided by the newsletters, trading, training and educational products related to various markets (collectively referred to as the "Services") is not customized or personalized to any particular risk profile or tolerance. Nor is the information published by Wendy Kirkland a customized or personalized recommendation to buy, sell, hold, or invest in particular financial products. Past performance is not necessarily indicative of future results. Trading and investing involve substantial risk and is not appropriate for everyone. The actual profit results presented here may vary with the actual profit results presented in other Wendy Kirkland publications due to the different strategies and time frames presented in other publications. Trading on margin carries a high level of risk, and may not be suitable for all investors. Other than the refund policy detailed elsewhere, Wendy Kirkland does not make any guarantee or other promise as to any results that may be obtained from using the Services. Wendy Kirkland disclaims any and all liability for any investment or trading loss sustained by a subscriber. You should trade or invest only "risk capital" - money you can afford to lose. Trading stocks and stock options involves high risk and you can lose the entire principal amount invested or more. There is no guarantee that systems, indicators, or trading signals will result in profits or that they will not produce losses.
Some profit examples are based on hypothetical or simulated trading. This means the trades are not actual trades and instead are hypothetical trades based on real market prices at the time the recommendation is disseminated. No actual money is invested, nor are any trades executed. Hypothetical or simulated performance is not necessarily indicative of future results. Hypothetical performance results have many inherent limitations, some of which are described below. Also, the hypothetical results do not include the costs of subscriptions, commissions, or other fees. Because the trades underlying these examples have not actually been executed, the results may understate or overstate the impact of certain market factors, such as lack of liquidity. Wendy Kirkland makes no representations or warranties that any account will or is likely to achieve profits similar to those shown. No representation is being made that you will achieve profits or the same results as any person providing a testimonial. Testimonials relate to various other products offered by Wendy Kirkland and not the product offered here, but all of these products are based on Wendy Kirkland's system. Performance results of other products described in such testimonials may be materially different from results for the product being offered and may have been achieved before the product being offered was developed.
Results described in testimonials from other products or the product being offered may not be typical or representative of results achieved by other users of such products. No representation is being made that any of the persons who provide testimonials have continued to experience the same level of profitable trading after the date on which the testimonial was provided. In fact, such persons may have experienced losses immediately thereafter or may have experienced losses preceding the period of time referenced in the testimonial. No representation is being made that you will achieve profits or the same results as any person providing a testimonial. Wendy Kirkland's experiences are not typical. Wendy Kirkland is an experienced investor and your results will vary depending on risk tolerance, amount of risk capital utilized, size of trading position, willingness to follow the rules and other factors.
|


No comments:
Post a Comment