 - To get ahead in business, companies use data to find out what customers want and when they want it.
- Our Stock Power Ratings system tells you which stocks are good investments … and which one’s aren’t.
- Today’s Stock to Avoid is a data analytics software developer that rates a “High-Risk” 1 out of 100 on our proprietary system.
|  | I look at data every day.
I love the stories that numbers can tell us…
Numbers aren’t biased or emotional.
They are objective facts about the state of whatever it is you are analyzing.
That’s why businesses turn to data in challenging economic times.
By transforming numbers into insights with data analysis, businesses can get a better handle on what their customers want, when they want it and how much they’ll pay for it.
It takes a lot of the guesswork out of running a business.
According to Wakefield Research, 54% of businesses in the U.S. and Europe use data and analytics to help drive more revenue.
But with our Stock Power Ratings system, you can see that, while businesses are turning to data analytics to improve their bottom lines, some companies providing proprietary software aren’t strong stocks to buy.
Click here to see why that’s the case for the “High-Risk” stock. 
 | From our Partners at Banyan Hill Publishing. A looming financial event that one expert calls the “Middle-Class Massacre” will soon devastate millions of hardworking Americans.
When it strikes, and all his research proves it will strike in 2023, he predicts stocks will crash 50% ... real estate will be slashed in half ... unemployment will surge to record highs ... and the wealth of millions will be decimated as the biggest bubble in history bursts.
Go here for the full story… |
1 Indicator to Track the Current Bullish Trend Breadth indicators measure how many stocks are participating in a trend.
A popular breadth indicator is the percentage of stocks trading above their 200-day moving average. It’s bullish right now but doesn't offer well-timed trade signals.
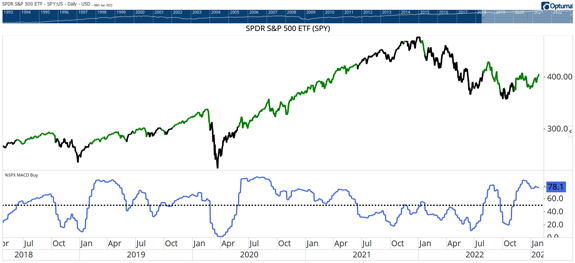
We can use a popular momentum indicator for that: the percentage of stocks on a moving average convergence/divergence (MACD) buy signal.
The chart below shows the percentage of stocks in the S&P 500 Index flashing a buy signal, with green segments of the price line showing when the indicator is greater than 50%.
The recent burst higher is usually associated with a new trend.
But while the indicator remains in bullish territory, it’s weakening. Check out the trend on blue line at the bottom of the chart.
A reversal would indicate this recent move was a bear market rally.
Bottom line: It’s worth following this indicator closely.  (Click here to view larger image.)
Check Out the Latest From Stock Power Daily: |
Privacy Policy
The Money & Markets, P.O. Box 8378, Delray Beach, FL 33482.
To ensure that you receive future issues of Money & Markets, please add info@mb.moneyandmarkets.com to your address book or whitelist within your spam settings. For customer service questions or issues, please contact us for assistance.
The mailbox associated with this email address is not monitored, so please do not reply. Your feedback is very important to us so if you would like to contact us with a question or comment, please click here: https://moneyandmarkets.com/contact-us/
Legal Notice: This work is based on what we've learned as financial journalists. It may contain errors and you should not base investment decisions solely on what you read here. It's your money and your responsibility. Nothing herein should be considered personalized investment advice. Although our employees may answer general customer service questions, they are not licensed to address your particular investment situation. Our track record is based on hypothetical results and may not reflect the same results as actual trades. Likewise, past performance is no guarantee of future returns. Certain investments carry large potential rewards but also large potential risk. Don't trade in these markets with money you can't afford to lose. Money & Markets permits editors of a publication to recommend a security to subscribers that they own themselves. However, in no circumstance may an editor sell a security before our subscribers have a fair opportunity to exit. Any exit after a buy recommendation is made and prior to issuing a sell notification is forbidden. The length of time an editor must wait after subscribers have been advised to exit a play depends on the type of publication.
(c) 2023 Money & Markets, LLC. All Rights Reserved. Protected by copyright laws of the United States and treaties. This Newsletter may only be used pursuant to the subscription agreement. Any reproduction, copying, or redistribution, (electronic or otherwise) in whole or in part, is strictly prohibited without the express written permission of Money & Markets. P.O. Box 8378, Delray Beach, FL 33482. (TEL: 800-684-8471)
Remove your email from this list: Click here to Unsubscribe | | | | | | |


No comments:
Post a Comment