| Hey, J.R. here,
You will never get a Chart Madness like this during the weekend from your local banker, stockbroker, accountant, or coworkers, so please…open and read it.
How is your weekend, dear reader?
Are you relaxing while those bastardos (Big Boys on Wall Street) refine their processes, skills, and tools to take YOUR hard-earned money?
I cannot rest nor take a break as long as they kick it; You and I must do the same; it is a never-ending saga.
Let's go over the weekend drill to figure out what's behind all the lies the media sells the world about the US Financial Markets; Chart Madness starts now…!
The forward 12-month P/E ratio for the S&P 500 is 17.5.
This P/E ratio is below the 5-year average (18.5) but above the 10-year average (17.2). | 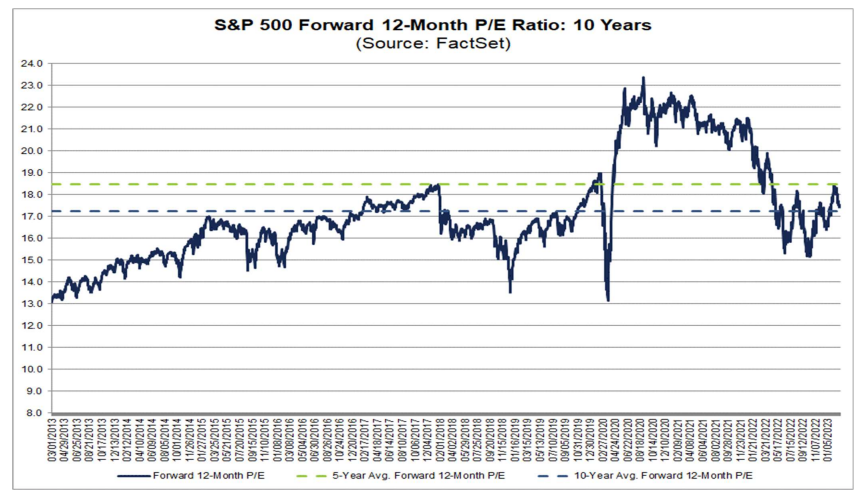 | What an ugly chart this one is, J.R. can you please give me some context?
Sure thing, dear reader…
Bottom line: the market is less expensive than some love to dramatize, but not that cheap.
Are you ready to thrive in this Bear Market? — click here to join me live tonight at 8 PM EST.
Energy sector with the worst EPS growth in 2023 | 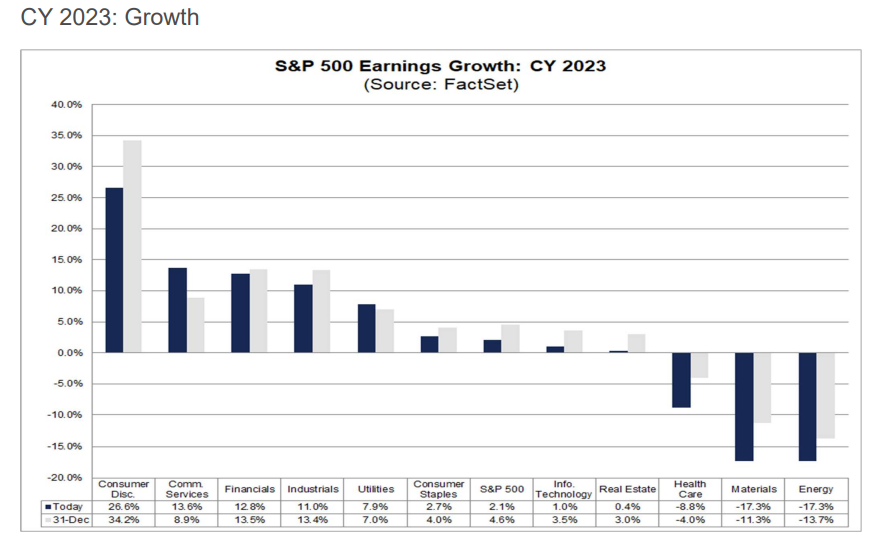 | Bottom line: can someone please tell the clown school at CNBC to stop pumping energy stocks?
US ISM manufacturing minus China PMI manufacturing (relative)
| 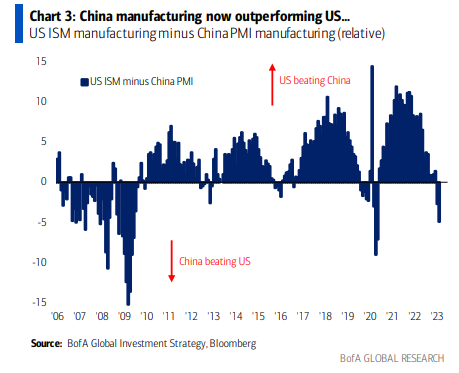 | Bottom line: how often do I have to repeat that without China, we will not have a Bull Market in America?
Equity funds are on track for $107bn inflows in 2023. | 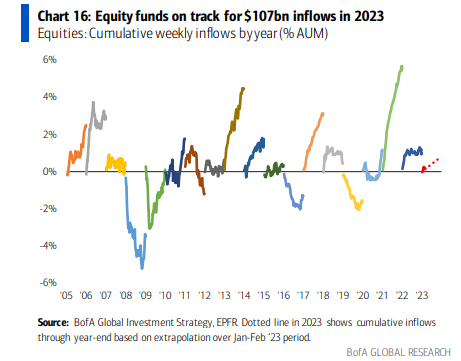 | Bottom line: let that sink; $107bn is billions of dollars flowing to equities.
Stop showing up to the gunfight with a knife.
Your opportunity to join the Surveillance Capitalism revolution is now.
Click now to learn how YOU can potentially make back your 2022 losses.
Until my following email,
¡Viva América!
J. R. Jaén
Editor, Market Surveillance Alliance
| | | |